The demographic landscape of Asian Indian and Chinese American communities has been a subject of interest for many years. With the growing diversity of the United States, it is essential to understand the differences and similarities between these two significant groups. In this article, we will delve into the demographic data comparison between Asian Indian and Chinese American communities, exploring various aspects that set them apart and bring them together.
Demographic Profile
A demographic profile of Asian Indian and Chinese American adults reveals some striking similarities. Both groups have a higher median age compared to the overall US population, with Asian Indians having a median age of 38 and Chinese Americans having a median age of 37. This suggests that both communities are experiencing a similar aging trend. However, there are some notable differences in terms of marital status, with 54% of Asian Indians being married, compared to 46% of Chinese Americans.
Economic Status
In terms of economic status, both Asian Indian and Chinese American communities have a higher median household income compared to the overall US population. Asian Indians have a median household income of $83,000, while Chinese Americans have a median household income of $74,000. This suggests that both communities are experiencing economic prosperity. However, there are some differences in terms of employment, with 64% of Asian Indians being employed in management, business, science, and arts occupations, compared to 56% of Chinese Americans.
Education
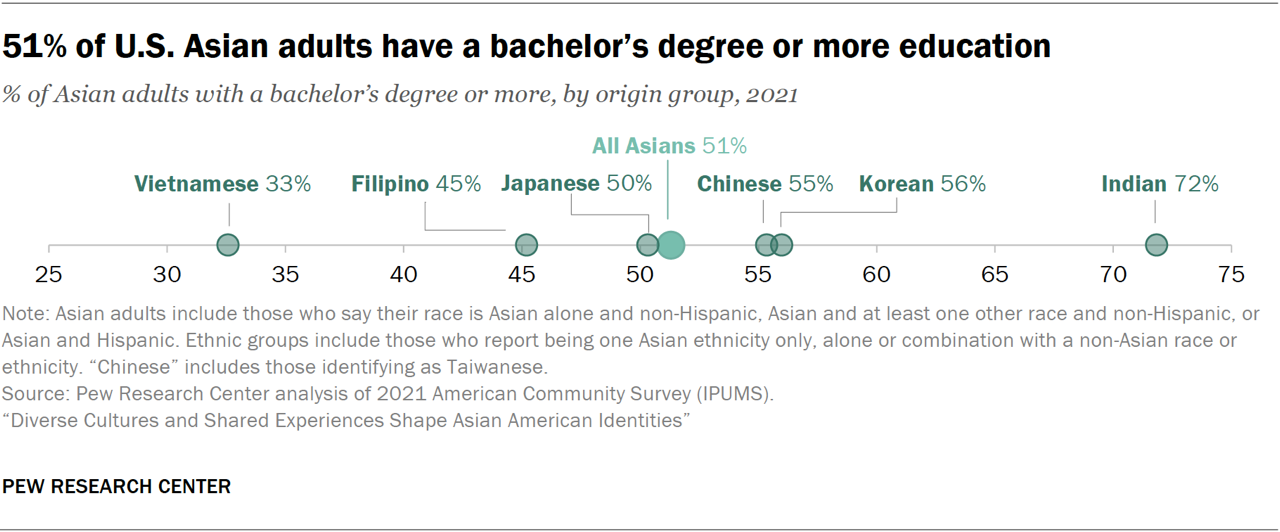
Education is another area where both Asian Indian and Chinese American communities excel. Both groups have a higher percentage of individuals holding a bachelor’s degree or higher, with 64% of Asian Indians and 58% of Chinese Americans meeting this criteria. This suggests that both communities place a strong emphasis on education. However, there are some differences in terms of educational attainment, with 34% of Asian Indians holding a master’s degree or higher, compared to 26% of Chinese Americans.
Language
Language is an important aspect of any community, and both Asian Indian and Chinese American communities have a unique linguistic landscape. While 71% of Asian Indians speak a language other than English at home, 55% of Chinese Americans do the same. This suggests that both communities have a strong connection to their cultural heritage. However, there are some differences in terms of language proficiency, with 44% of Asian Indians speaking English “not very well” or “not at all,” compared to 31% of Chinese Americans.
Conclusion
In conclusion, the demographic data comparison between Asian Indian and Chinese American communities reveals both similarities and differences. While both groups share some commonalities, such as a higher median age and a strong emphasis on education, there are also some notable differences. By understanding these differences and similarities, we can gain a deeper appreciation for the diversity of the United States and the unique experiences of these two significant communities.
The data presented in this article provides a comprehensive overview of the demographic landscape of Asian Indian and Chinese American communities. By exploring various aspects of these communities, we can gain a better understanding of the complexities of diversity in the United States.