Demographic Data for Bicycle Infrastructure Prioritization
As cities around the world continue to grapple with the challenges of urbanization, one thing is clear: bicycle infrastructure is no longer a nicety, but a necessity. But how do we prioritize the construction of these vital routes? The answer lies in demographic data.
Understanding the Demographics of Cycling
When it comes to understanding the demographics of cycling, it’s essential to consider the who, what, where, and why. Who is most likely to use a bicycle? What are the key factors that influence their decision to cycle? Where are the most popular cycling routes, and why do they matter? And, most importantly, why do people choose to cycle in the first place?
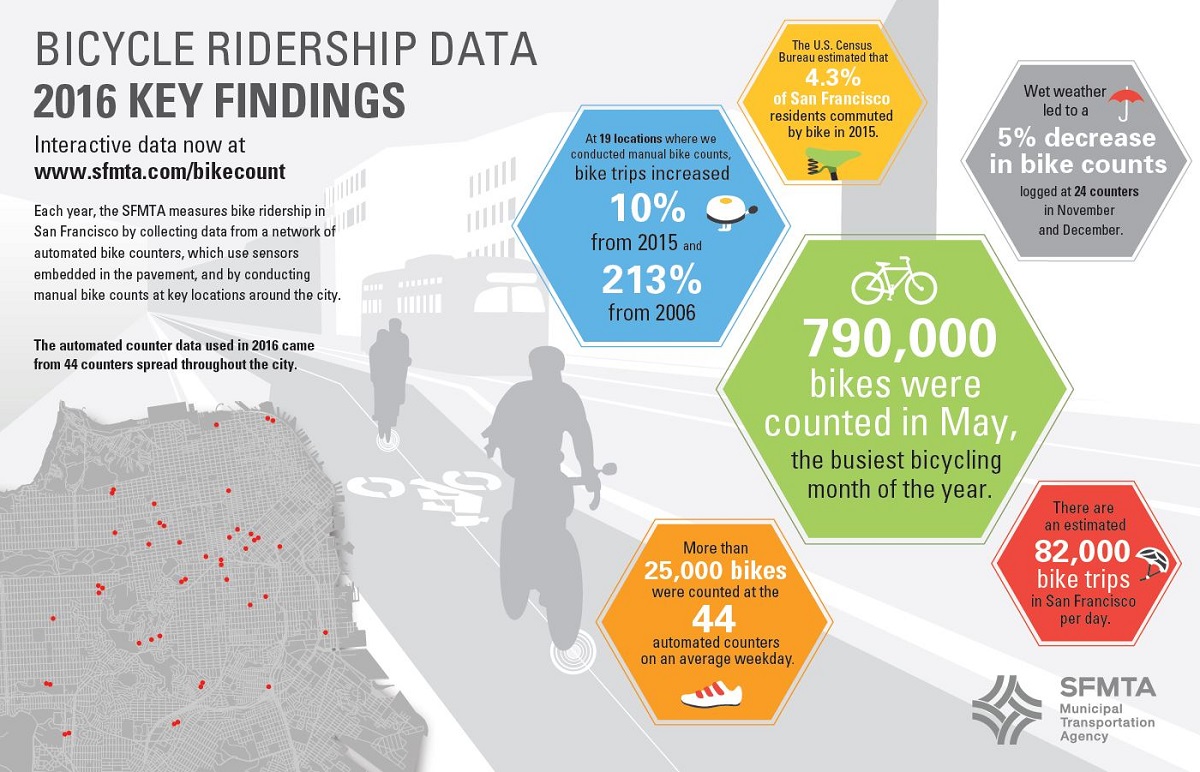
According to the SFMTA, bicycle ridership data from 2016 reveals some fascinating insights. For instance, did you know that 62% of bicycle riders are between the ages of 25 and 44? Or that 55% of riders are male, while 45% are female? These statistics offer a glimpse into the demographics of cycling and can help inform the design of bicycle infrastructure.
Key Findings in 2016
Another crucial aspect of demographic data is understanding the key findings in a given year. In 2016, the SFMTA reported some striking statistics. For example, did you know that 44% of bicycle riders were commuting to work or school? Or that 31% were using bicycles for recreation or leisure activities? These figures can help prioritize the construction of bicycle infrastructure, ensuring that it meets the needs of the most frequent users.
Bicycle Infrastructure: A Research Priority
But what about the actual infrastructure itself? How do we ensure that it’s designed with the needs of cyclists in mind? The answer lies in research. At the BicyclingPlus Research Collaborative, researchers are working tirelessly to advance the field of bicycle infrastructure. Their work is crucial in informing the design of routes that are safe, accessible, and enjoyable for all users.
As we move forward in our efforts to prioritize bicycle infrastructure, it’s essential to remember that demographic data is just the beginning. By combining these insights with a deep understanding of the needs of cyclists, we can create a more sustainable, equitable, and enjoyable urban environment for all.